
AGF Management Limited Reports First Quarter 2026 Financial Results
TORONTO, April 14, 2026 (GLOBE NEWSWIRE) --
- Reported quarterly adjusted diluted earnings per share of $0.30
- Reported quarterly adjusted diluted earnings per share excluding AGF Capital Partners of $0.35, up 21% from prior year
- Reported quarterly adjusted diluted earnings per share for AGF Capital Partners of -$0.05 due to non-cash fair value adjustments in legacy long-term investments
- Free cash flows of $36.0 million in the quarter, up 14% from prior year
- Total assets under management and fee-earning assets of $60.5 billion, up 12% from prior year
- Increased quarterly dividend per share by 8% to 13.5 cents
AGF Management Limited (AGF or the Company) (TSX: AGF.B) today announced financial results for the first quarter ended February 28, 2026.
AGF reported total assets under management and fee-earning assets1 of $60.5 billion compared to $60.4 billion as at November 30, 2025 and $53.8 billion as at February 28, 2025. AGF generated strong free cash flows of $36.0 million in the quarter, up 14% from the prior year.
AGF declared a 13.5 cents per share quarterly dividend, representing an 8% increase. This is the sixth consecutive year of dividend increases.
“Our business continues to demonstrate its durability as a result of our multi-year strategy to diversify across asset classes and client channels allowing us to navigate the impacts of the current economic environment while maintaining our strong balance sheet,” said Judy Goldring, Chief Executive Officer, AGF.
AGF Investments'mutual fund gross sales were $1,650 million for the quarter compared to $1,425 million in the prior period and $1,568 million in the comparative prior year period. Retail mutual fund2 net sales were $237 million compared to $282 million in the prior period and $342 million in the comparative prior year period.
“AGF Investments saw continued momentum with strong flows across a diverse set of products. We were again recognized for our investment performance with numerous industry awards, and saw accelerating demand for our alternative capabilities,” added Goldring.
During the quarter, -$16.8 million non-cash fair value adjustments were recorded in AGF Capital Partners'long-term investments, partially offset by $6.2 million in distributions received resulting in revenues from long-term investments of -$10.6 million. This represents a net -2.5% decline in the value of our long-term investments during the period.
“The long-term investments decline was driven by our legacy investments in the infrastructure space, a sector that has not been immune from the impacts of the current economic and trade environment,” added Goldring.
1 Fee-earning assets represents assets in which AGF has carried interest ownership and earns recurring fees but does not have ownership interest in the managers.
2 Retail mutual fund net sales (redemptions) are calculated as reported mutual fund net sales (redemption) less non-recurring institutional net sales (redemptions) in excess of $5 million invested in our mutual funds.
Key Business Highlights:
AGF was selected as an Excellence Awardee at the Wealth Professional Awards in three categories: Employer of Choice, Mutual Fund Provider of the Year and CEO of the Year for Judy Goldring.
Subsequent to quarter end, AGF was named to the Nasdaq Dividend Achievers Index, recognizing the firm’s consistent track record of increasing dividends and its commitment to delivering long-term shareholder value.
AGF Investments
In January, AGF Investments Inc. launched ETF series units for AGF American Growth Fund and AGF Global Select Fund, providing investors with access to two long-standing strategies with established track records through an ETF structure. The launch expanded the firm’s ETF lineup, while responding to growing investor demand for greater choice in how they access AGF’s investment capabilities.
AGF Investments Inc. received seven 2025 Fundata FundGrade A+® Awards for Outstanding Fund Performance, recognizing the strong, long-term results delivered by AGF’s investment teams on behalf of investors across market cycles.
- AGF American Growth Fund
- AGF Fixed Income Plus Fund
- AGF Global Balanced Growth Portfolio Fund
- AGF Global Conservative Portfolio Fund
- AGF Global Convertible Bond Fund
- AGF Global Moderate Portfolio Fund
- AGF Global Select Fund
AGF Capital Partners
AGF Capital Partners Affiliate Manager New Holland Capital (NHC) launched an evergreen private credit fund for institutional investors providing access to niche specialty finance investment opportunities.
NHC’s overall AUM increased to C$10.5 billion over the course of two years, which includes C$2.8 billion under management in its flagship hedge fund strategies.
Financial Highlights:
- Adjusted EBITDA3 for the three months ended February 28, 2026 was $30.3 million, compared to $52.4 million for the three months ended November 30, 2025 and $47.9 million for the comparative prior year period.
- Net management, advisory and administration fees3 for the three months ended February 28, 2026 was $92.5 million, compared to $94.8 million for the three months ended November 30, 2025 and $85.2 million for the comparative prior year period.
- Adjusted selling, general and administrative costs for the three months ended February 28, 2026 was $65.0 million, compared to $67.9 million for the three months ended November 30, 2025 and $63.6 million for the comparative prior year period. Adjusted SG&A decreased compared to the prior period, primarily due to lower non-compensation expenses, and increased over the comparable prior year period, driven by higher performance-based compensation and higher non-compensation expenses primarily due to inflation, an increase in sales and marketing, and AUM driven expenses.
- Adjusted EBITDA from AGF Capital Partners for the three months ended February 28, 2026, was -$3.8 million, compared to $16.7 million for the three months ended November 30, 2025 and $18.6 million for the comparative prior year period. The decrease from the prior period and comparable prior year period is primarily related to lower revenue from long-term investments.
- Adjusted EBITDA excluding AGF Capital Partners of $34.1 million for the three months ended February 28, 2026, compared to $35.7 million for the three months ended November 30, 2025 and $29.3 million for the comparative prior year period.
- Adjusted net income attributable to equity owners3 for the three months ended February 28, 2026 was $19.7 million ($0.30 adjusted diluted EPS), compared to $41.2 million ($0.62 adjusted diluted EPS) for the three months ended November 30, 2025 and $32.1 million ($0.48 adjusted diluted EPS) for the comparative prior year period.
- Free cash flow of $36.0 million for the three months ended February 28, 2026, compared to $31.5 million for the three months ended November 30, 2025 and $31.6 million for the comparative prior year period.
| Three months ended | |||||||||||
| February 28, | November 30, | February 28, | |||||||||
| (in millions of Canadian dollars, except per share data) | 2026 | 2025 | 2025 | ||||||||
| Revenues | |||||||||||
| Management, advisory and administration fees | $ | 131.0 | $ | 133.8 | $ | 122.8 | |||||
| Trailing commissions and investment advisory fees | (38.5 | ) | (39.0 | ) | (37.6 | ) | |||||
| Net management, advisory and administration fees3 | $ | 92.5 | $ | 94.8 | $ | 85.2 | |||||
| Deferred sales charges | 0.9 | 0.9 | 1.2 | ||||||||
| Adjusted revenue from AGF Capital Partners3 | 0.8 | 22.4 | 23.6 | ||||||||
| Other revenue3 | 1.1 | 2.2 | 1.5 | ||||||||
| Total adjusted net revenue3 | 95.3 | 120.3 | 111.5 | ||||||||
| Selling, general and administrative | 67.5 | 68.2 | 67.8 | ||||||||
| Adjusted selling, general and administrative3 | 65.0 | 67.9 | 63.6 | ||||||||
| EBITDA3 | 28.3 | 56.6 | 44.2 | ||||||||
| EBITDA margin3 | 29.6 | % | 47.0 | % | 39.6 | % | |||||
| Adjusted EBITDA3 | 30.3 | 52.4 | 47.9 | ||||||||
| Adjusted EBITDA margin3 | 31.8 | % | 43.6 | % | 43.0 | % | |||||
| Net income - equity owners of the Company | 18.0 | 44.9 | 30.9 | ||||||||
| Adjusted net income - equity owners of the Company3 | 19.7 | 41.2 | 32.1 | ||||||||
| Diluted earnings per share | 0.27 | 0.67 | 0.46 | ||||||||
| Adjusted diluted earnings per share3 | 0.30 | 0.62 | 0.48 | ||||||||
| Free cash flow3 | 36.0 | 31.5 | 31.6 | ||||||||
| Dividends paid per share | 0.125 | 0.125 | 0.115 | ||||||||
| Three months ended | ||||||||
| February 28, | November 30, | February 28, | ||||||
| (in millions of Canadian dollars) | 2026 | 2025 | 2025 | |||||
| Mutual fund assets under management (AUM)4 | $ | 35,817 | $ | 34,984 | $ | 31,167 | ||
| ETFs and SMA AUM | 4,492 | 4,136 | 2,913 | |||||
| Segregated accounts and sub-advisory AUM | 5,923 | 7,190 | 6,529 | |||||
| Total AGF Investments AUM | 46,232 | 46,310 | 40,609 | |||||
| AGF Private Wealth AUM | 9,764 | 9,488 | 8,623 | |||||
| AGF Capital Partners AUM | 2,345 | 2,454 | 2,468 | |||||
| Total AUM | $ | 58,341 | $ | 58,252 | $ | 51,700 | ||
| AGF Capital Partners fee-earning assets5 | 2,120 | 2,136 | 2,142 | |||||
| Total AUM and fee-earning assets5 | $ | 60,461 | $ | 60,388 | $ | 53,842 | ||
| Mutual fund net sales4 | 190 | 276 | 258 | |||||
| Retail mutual fund net sales2 | 237 | 282 | 342 | |||||
| Average daily mutual fund AUM4 | 35,154 | 34,424 | 30,853 | |||||
3 Net management, advisory and administration fees, adjusted revenue from AGF Capital Partners, total adjusted net revenue, adjusted selling, general and administrative, EBITDA, EBITDA margin, adjusted EBITDA, adjusted EBITDA margin, adjusted net income, adjusted diluted earnings per share and free cash flow are not standardized measures prescribed by IFRS. The Company utilizes non-IFRS measures to assess our overall performance and facilitate a comparison of quarterly and full-year results from period to period. They allow us to assess our investment management business without the impact of non-operational items. These non-IFRS measures may not be comparable with similar measures presented by other companies. These non-IFRS measures and reconciliations to IFRS, where necessary, are included in the Management’s Discussion and Analysis available at www.agf.com.
4 Mutual fund AUM includes retail AUM and institutional client AUM invested in customized series offered within mutual funds.
5 Fee-earning assets represents assets in which AGF has carried interest ownership and earns recurring fees but does not have ownership interest in the managers.
For further information and detailed financial statements for the first quarter ended February 28, 2026, including Management’s Discussion and Analysis, which contains discussions of non-IFRS measures, please refer to AGF’s website at www.agf.com under ‘About AGF'and ‘Investor Relations'and at www.sedarplus.ca.
Conference Call
AGF will host a conference call to review its earnings results today at 11 a.m. ET.
The live audio webcast with supporting materials will be available in the Investor Relations section of AGF’s website at www.agf.com or at https://edge.media-server.com/mmc/p/pdxua75r.Alternatively, the call can be accessed over the phone by registering here or in the Investor Relations section of AGF’s website at www.agf.com, to receive the dial-in numbers and unique PIN.
A complete archive of this discussion along with supporting materials will be available at the same webcast address within 24 hours of the end of the conference call.
About AGF Management Limited
Founded in 1957, AGF Management Limited (AGF) is an independent and globally diverse asset management firm. Our companies deliver excellence in investing in the public and private markets through three business lines: AGF Investments, AGF Capital Partners and AGF Private Wealth.
AGF brings a disciplined approach, focused on incorporating sound, responsible and sustainable corporate practices. The firm’s collective investment expertise, driven by its fundamental, quantitative and private investing capabilities, extends globally to a wide range of clients, from financial advisors and their clients to high-net worth and institutional investors including pension plans, corporate plans, sovereign wealth funds, endowments and foundations.
Headquartered in Toronto, Canada, AGF has investment operations and client servicing teams on the ground in North America and Europe. With over $60 billion in total assets under management and fee-earning assets, AGF serves more than 820,000 investors. AGF trades on the Toronto Stock Exchange under the symbol AGF.B.
About AGF Investments
AGF Investments is a group of wholly owned subsidiaries of AGF Management Limited, a Canadian reporting issuer. The subsidiaries included in AGF Investments are AGF Investments Inc. (AGFI), AGF Investments LLC (AGFUS) and AGF International Advisors Company Limited (AGFIA). The term AGF Investments may refer to one or more of these subsidiaries or to all of them jointly. This term is used for convenience and does not precisely describe any of the separate companies, each of which manages its own affairs. AGF Investments entities only provide investment advisory services or offers investment funds in the jurisdiction where such firm and/or product is registered or authorized to provide such services.
About AGF Capital Partners
AGF Capital Partners is AGF’s multi-boutique alternatives business with Affiliate Managers across both private assets and alternative strategies. Clients benefit from the specialized investment expertise of Affiliate Managers1 combined with the organizational support and breadth of resources of AGF Management Limited (AGF). With over 19 years average experience, AGF Capital Partners Affiliate Managers including, Kensington Capital Partners Limited, New Holland Capital, LLC and AGF SAF Private Credit, manage approximately C$15.0 billion* in alternative AUM and fee earning assets on behalf of institutional and retail clients. Affiliate Manager AUM may not be consolidated into AGF Management Limited's reported AUM.
*U.S. AUM converted FX rate as at February 28, 2026 (1.36)
The term ‘Affiliate Manager'refers to any partner regardless of relationship structures or revenue sharing agreements. The form of AGF’s structured partnership interests in Affiliate Managers differs from Affiliate Manager to Affiliate Manager. The structure of the relationship with a particular Affiliate Manager, or the revenue that AGF agrees to share in, may change. Affiliate Managers only provide investment advisory services or offer products in the jurisdiction where such firm, individuals and/or product is registered or authorized to provide such services.
Commissions, trailing commissions, management fees and expenses all may be associated with investment fund investments. Please read the prospectus before investing. Investment funds are not guaranteed, their values change frequently, and past performance may not be repeated.
AGF Management Limited shareholders, analysts and media, please contact:
Nick Smerek
VP, Financial Planning & Analysis
416-865-4337, InvestorRelations@agf.com
Caution Regarding Forward-Looking Statements
This press release includes forward-looking statements about the Company, including its business operations, strategy and expected financial performance and condition. Forward-looking statements include statements that are predictive in nature, depend upon or refer to future events or conditions, or include words such as ‘expects,'‘estimates,'‘anticipates,'‘intends,'‘plans,'‘believes'or negative versions thereof and similar expressions, or future or conditional verbs such as ‘may,'‘will,'‘should,'‘would'and ‘could.'In addition, any statement that may be made concerning future financial performance (including income, revenues, earnings or growth rates), ongoing business strategies or prospects, fund performance, and possible future action on our part, is also a forward-looking statement. Forward-looking statements are based on certain factors and assumptions, including expected growth, results of operations, business prospects, business performance and opportunities. While we consider these factors and assumptions to be reasonable based on information currently available, they may prove to be incorrect. Forward-looking statements are based on current expectations and projections about future events and are inherently subject to, among other things, risks, uncertainties and assumptions about our operations, economic factors and the financial services industry generally. They are not guarantees of future performance, and actual events and results could differ materially from those expressed or implied by forward-looking statements made by us due to, but not limited to, important risk factors such as level of assets under our management, volume of sales and redemptions of our investment products, performance of our investment funds and of our investment managers and advisors, client-driven asset allocation decisions, pipeline, competitive fee levels for investment management products and administration, and competitive dealer compensation levels and cost efficiency in our investment management operations, as well as general economic, political and market factors in North America and internationally, interest and foreign exchange rates, global equity and capital markets, business competition, taxation, changes in government regulations, unexpected judicial or regulatory proceedings, technological changes, cybersecurity, the possible effects of war or terrorist activities, outbreaks of disease or illness that affect local, national or international economies, natural disasters and disruptions to public infrastructure, such as transportation, communications, power or water supply or other catastrophic events, and our ability to complete strategic transactions and integrate acquisitions, and attract and retain key personnel. We caution that the foregoing list is not exhaustive. The reader is cautioned to consider these and other factors carefully and not place undue reliance on forward-looking statements. Other than specifically required by applicable laws, we are under no obligation (and expressly disclaim any such obligation) to update or alter the forward-looking statements, whether as a result of new information, future events or otherwise. For a more complete discussion of the risk factors that may impact actual results, please refer to the ‘Risk Factors and Management of Risk'section of the 2025 Annual MD&A.
About Fundata Canada Inc.
Fundata Canada Inc. has been providing data aggregation and dissemination services to the Canadian media and financial marketplace since 1987. Fundata is a major provider in the distribution of fund and stock information in Canada.
FundGrade A+® Awards:
FundGrade A+® is used with permission from Fundata Canada Inc., all rights reserved. The annual FundGrade A+® Awards are presented by Fundata Canada Inc. to recognize the “best of the best” among Canadian investment funds. The FundGrade A+® calculation is supplemental to the monthly FundGrade ratings and is calculated at the end of each calendar year. The FundGrade rating system evaluates funds based on their risk-adjusted performance, measured by Sharpe Ratio, Sortino Ratio, and Information Ratio. The score for each ratio is calculated individually, covering all time periods from 2 to 10 years. The scores are then weighted equally in calculating a monthly FundGrade. The top 10% of funds earn an A Grade; the next 20% of funds earn a B Grade; the next 40% of funds earn a C Grade; the next 20% of funds receive a D Grade; and the lowest 10% of funds receive an E Grade. To be eligible, a fund must have received a FundGrade rating every month in the previous year. The FundGrade A+® uses a GPA-style calculation, where each monthly FundGrade from “A” to “E” receives a score from 4 to 0, respectively. A fund’s average score for the year determines its GPA. Any fund with a GPA of 3.5 or greater is awarded a FundGrade A+® Award. For more information, see www.FundGradeAwards.com. Although Fundata makes every effort to ensure the accuracy and reliability of the data contained herein, the accuracy is not guaranteed by Fundata.
The FundGrade A+® rating is used with permission from Fundata Canada Inc., all rights reserved. Fundata is a leading provider of market and investment funds data to the Canadian financial services industry and business media. The Fund-Grade A+® rating identifies funds that have consistently demonstrated the best risk-adjusted returns throughout an entire calendar year. For more information on the rating system, please visit https://www.fundata.com/ProductsServices/FundGrade.aspx.
AGF American Growth Fund has received a FundGrade A+® Award for the year 2025 in the U.S. Equity CIFSC category, out of 256 funds. The FundGrade A+® Award for the Fund is calculated from 12/31/2015 to 12/31/2025. The Fund’s most recent month end performance is shown in the Annualized Compound Returns [here].
AGF Fixed Income Plus Fund has received a FundGrade A+® Award for the year 2025 in the Canadian Core Plus Fixed Income CIFSC category, out of 32 funds. The FundGrade A+® Award for the Fund is calculated from 12/31/2015 to 12/31/2025. The Fund’s most recent month end performance is shown in the Annualized Compound Returns [here].
AGF Global Balanced Growth Portfolio Fund has received a FundGrade A+® Award for the year 2025 in the Global Equity Balanced CIFSC category, out of 190 funds. The FundGrade A+® Award for the Fund is calculated from 12/31/2022 to 12/31/2025. The Fund’s most recent month end performance is shown in the Annualized Compound Returns [here].
AGF Global Conservative Portfolio Fund has received a FundGrade A+® Award for the year 2025 in the Global Fixed Income Balanced CIFSC category, out of 136 funds. The FundGrade A+® Award for the Fund is calculated from 12/31/2022 to 12/31/2025. The Fund’s most recent month end performance is shown in the Annualized Compound Returns [here].
AGF Global Convertible Bond Fund has received a FundGrade A+® Award for the year 2025 in the High Yield Fixed Income CIFSC category, out of 50 funds. The FundGrade A+® Award for the Fund is calculated from 12/31/2015 to 12/31/2025. The Fund’s most recent month end performance is shown in the Annualized Compound Returns [here].
AGF Global Moderate Portfolio Fund has received a FundGrade A+® Award for the year 2025 in the Global Neutral Balanced CIFSC category, out of 226 funds. The FundGrade A+® Award for the Fund is calculated from 12/31/2022 to 12/31/2025. The Fund’s most recent month end performance is shown in the Annualized Compound Returns [here].
AGF Global Select Fund has received a FundGrade A+® Award for the year 2025 in the Global Equity CIFSC category, out of 314 funds. The FundGrade A+® Award for the Fund is calculated from 12/31/2015 to 12/31/2025. The Fund’s most recent month end performance is shown in the Annualized Compound Returns [here].

- BASF Environmental Catalyst and Metal Solutions 在德国布登海姆的新绿色氢能源投资项目破土动工
- 以天然营养赋能“健康中国”,佳沛于第八届进博会分享长期健康承诺
- 四川首个煤矿安全“保险+科技+服务”生态落地! 中国人寿财险护航煤矿业行稳致远
- 蒋沐原书法作品欣赏(附文敬告+润格)
- 点燃新质生产力“火花” 诺奖得主英雄论道中新广州知识城
- 怡和嘉业,医械「中国范儿」收获国际认可
- 大王椰荣登“匠心板材十大品牌”, 二十五载铸就家居产业高质量发展样本
- 冈司镜片:专研国人用眼习惯,更适合国人佩戴
- 靖洋集团公布2024年年度业绩
- 欧洲黄心奇异果重返亚洲市场
- 2025冲锋衣十大品牌排名出炉,国货性能比肩国际大牌
- 中国第七届OTC品牌宣传月社区健康行第三站——九洲大药房站圆满收官!
- 劳动最光荣 幸福我创造
- uSMART Capital, LLC 正式获批美国Finra券商牌照
- 香港数字金融科技有限公司,连接传统金融与数字经济的新锐力量
- 万纬“万店配”统仓共配产品在苏皖地区启动
- 浪潮卓数大数据旗下天元征信获“2024年度大数据科学技术奖”一等奖
- Cardboard Peg Hook Display Stand for Retail
- 2025中国国际石油化工技术装备展6月5日在沪强势来袭
- 中国机甲第一人孙世前携东方机甲系列机甲装置在珠海展出
- 云顶新耀宣布增加对I-Mab的战略投资 开发自研新一代肿瘤免疫疗法的全球价值
- 辣炒年糕到辣椒脆烤鸡 辣味美食的治愈力量!
- 媒体撤回侨雄国际涉嫌操纵股价报道
- 凡泰极客亮相白鲸出海全球游戏对接峰会,探索小游戏出海新路径
- Snail Games 签署合作派对动作游戏《Dead Party》发行协议,拓展产品版图
- 临港耀华国际学校 200 余门课程精彩亮
- 2025 CCF 大数据与计算智能大赛颁奖典礼在贵阳隆重举行
- 浪潮海岳软件受邀参加世界人工智能大会智能财务论坛
- 开放与融合:科创新航海时代——第六届长三角商业创新大会暨《2023长三角商业创新样本》发布会在沪成功举行
- 共迎“鑫”起点 | 鑫海移民乔迁仪式圆满结束,开启全球移民服务新篇章!
推荐
-
 一个“江浙沪人家的孩子已经不卷学习了”的新闻引发议论纷纷
星标★
来源:桌子的生活观(ID:zzdshg)
没
资讯
一个“江浙沪人家的孩子已经不卷学习了”的新闻引发议论纷纷
星标★
来源:桌子的生活观(ID:zzdshg)
没
资讯
-
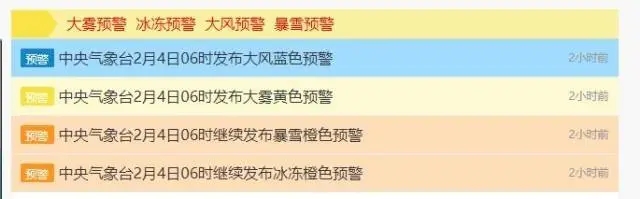 中央气象台连发四则气象灾害预警
暴雪橙色预警+冰冻橙色预警+大雾黄色预警+
资讯
中央气象台连发四则气象灾害预警
暴雪橙色预警+冰冻橙色预警+大雾黄色预警+
资讯
-
 透过数据看城乡居民医保“含金量” 缴费标准是否合理?
记者从国家医保局了解到,近期,全国大部分地区
资讯
透过数据看城乡居民医保“含金量” 缴费标准是否合理?
记者从国家医保局了解到,近期,全国大部分地区
资讯
-
 王自如被强制执行3383万
据中国执行信息公开网消息,近期,王自如新增一
资讯
王自如被强制执行3383万
据中国执行信息公开网消息,近期,王自如新增一
资讯
-
 海南大学生返校机票贵 有什么好的解决办法吗?
近日,有网友在“人民网领导留言板&rdqu
资讯
海南大学生返校机票贵 有什么好的解决办法吗?
近日,有网友在“人民网领导留言板&rdqu
资讯
-
 男子“机闹”后航班取消,同机旅客准备集体起诉
1月4日,一男子大闹飞机致航班取消的新闻登上
资讯
男子“机闹”后航班取消,同机旅客准备集体起诉
1月4日,一男子大闹飞机致航班取消的新闻登上
资讯
-
 大家一起关注新疆乌什7.1级地震救援见闻
看到热气腾腾的抓饭马上就要出锅、村里大家
资讯
大家一起关注新疆乌什7.1级地震救援见闻
看到热气腾腾的抓饭马上就要出锅、村里大家
资讯
-
 国足13次出战亚洲杯首次小组赛0进球
北京时间1月23日消息,2023亚洲杯小组
资讯
国足13次出战亚洲杯首次小组赛0进球
北京时间1月23日消息,2023亚洲杯小组
资讯
-
 奥运冠军刘翔更新社交账号晒出近照 时隔473天更新动态!
2月20日凌晨2点,奥运冠军刘翔更新社交账号晒
资讯
奥运冠军刘翔更新社交账号晒出近照 时隔473天更新动态!
2月20日凌晨2点,奥运冠军刘翔更新社交账号晒
资讯
-
 看新东方创始人俞敏洪如何回应董宇辉新号分流的?
(来源:中国证券报)
东方甄选净利润大幅下滑
资讯
看新东方创始人俞敏洪如何回应董宇辉新号分流的?
(来源:中国证券报)
东方甄选净利润大幅下滑
资讯